Table of Contents
There are many different terms and tools to analyze data in mathematics, with some being basic and others being much more in-depth. The mode is one of the more basic ones and will be one of the first things that is taught when it comes to analyzing data. However, that doesn’t mean it’s easy to recognize.
There’s also the fact that people tend to get confused between the terms mean, median, mode, and range. In any case, we figured the mode needed some clarification.
For that reason, in this article, we’ll explore what the mode is, what its uses are, and the advantages and disadvantages of using it.
What is the mode in maths?
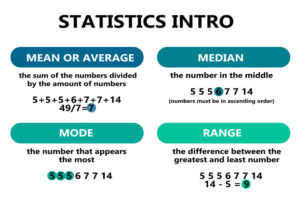
In maths, the mode is the most frequently occurring value in a data set and is often referred to as the value that occurs ‘most often’ in a data set. A data set can have one mode, many modes, or none at all. It will depend entirely on if there is a frequently occurring value or not. The mode can tell us something important.
The mode is one of the ways to assess a data set and find averages. The other two ways involve finding the mean and median. The mean, also referred to as the ‘arithmetic mean’, is the sum of all the values divided by the total number of values. This gives us the average value of the data set. The median is the middle value, or middle number, of an ordered list of numbers from smallest to largest. Together, the mean, median, and mode make up the three measures of a data set’s central tendency.
What is the mode used for?
When it comes to statistics, the most common way the mode is used, and also the best way to visualize it, is with a normal distribution curve – also known as a bell-curve distribution. With a normal distribution, the highest frequency value will also be the mean and median of the distribution since they will all have the same value. However, with most data sets, the mode, median, and mean will not be the same number.
As mentioned earlier, the mode is also used to measure central tendency – particularly when a mathematical median or mean cannot be used. This is most applicable to categorical data such as most popular family surnames, colors, models of cars, flavors of soft drinks, etc.
Examples of the Mode
Suppose you have a data set that consists of the following 20 numbers:
- 5, 7, 13, 25, 25, 25, 32, 39, 48, 49, 53, 55, 55, 58, 63, 69, 92, 92, 94, 99
In the above example, the number 25 is the mode since it is the most repeated value, occurring three times. Let’s take a look at another example:
- 5, 7, 13, 25, 25, 25, 32, 39, 48, 49, 53, 55, 55, 55, 63, 69, 92, 92, 94, 99
In the above example, we now have more than one mode. The numbers 25 and 55 both occur three times. This means that this data set is bimodal, meaning it has two modes. Let’s take a look at another example:
- 5, 7, 13, 21, 25, 28, 32, 39, 48, 49, 53, 54, 55, 57, 63, 69, 92, 91, 94, 99
In the above example, there are no values that appear more than once. Therefore, this data set has no modes.
Also Read This: Credit Card Generator | Top10 credit card generators that work
What are the advantages of the mode?
The mode is incredibly easy to understand and use. Identifying the mode is relatively straightforward, even when looking at a discrete frequency distribution. Although it’s pretty basic and rudimentary, it is also an essential tool for analyzing a data set. Also, unlike using the mean to measure central tendency, which can be skewed heavily by extreme numbers, the mode is not affected by this, which can sometimes provide a better understanding of your data. Additionally, the mode is typically beneficial if you want to illustrate data graphically. This is because the most frequent observations are so easy to identify visually.
Also Read This:Top 10 useful calculators for students
What are the disadvantages of the mode?
Whilst the mode is a simple tool which is undoubtedly an advantage, it can also be the reason for its limitations. If your data set does not have any repeat values or numbers, then a mode will not be defined, resulting in it being unusable. On the other hand, your data set might have more than one most frequent number, which will mean your data set has more than one mode. Whilst this could provide insight into the data set, it can also cause confusion.
Also, the mode can prove to be a little unstable when your data has a small number of total values. Finding a mode in the context of 100 data points will help you analyse the data much better than a 10 data point collection. Finally, since the mode only identifies the most frequently occurring value, it completely disregards the rest of the data set. This can have benefits since it won’t be influenced by outliers or extreme values, but it may just provide a micro view of the data, as opposed to a macro perspective.
What if I need help finding the mode in my data set?
Typically, sorting your data from smallest to largest or in alphabetical order will help you identify your mode. But, if you’re feeling stuck and are unable to determine whether your data set has a mode or not, there is help available. Nowadays, there are online maths tools for all kinds of things, from using a scientific calculator to finding the greatest common factor of two numbers; there are tools available for everything math-related. The mode is no different; there are plenty of mode calculators online to help you identify if your data has any.
Summary
The mode is one of the more straightforward concepts to grasp when it comes to mathematics. But it can still be tricky to determine if your data has one, especially if it’s a large data set. If you lookout for the value or number that appears the most, you will be able to find the mode. It will help to sort your data in ascending order. However, if you are under time constraints, there are plenty of online tools out there to help you.


![1000 Girl Attitude Names for Truecaller ID | UPDATED [Included Boys Names] 1000 Attitude Names for Girls on Truecaller](https://edutechbuddy.com/wp-content/uploads/2025/05/ChatGPT-Image-May-21-2025-11_59_39-PM-1-150x150.png)


![1000 Girl Attitude Names for Truecaller ID | UPDATED [Included Boys Names] 9 1000 Attitude Names for Girls on Truecaller](https://edutechbuddy.com/wp-content/uploads/2025/05/ChatGPT-Image-May-21-2025-11_59_39-PM-1.png)